Portfolio

Research

Interpreting bias in genomics: high-occupancy target regions

We used machine-learning models - elastic-net regression and principal component analysis (PCA) - to investigate genomic regions known as high-occupancy target (HOT) regions. These regions attract unusually high numbers of proteins and are likely technical artifacts of chromatin immunoprecipitation followed by sequencing (ChIP-seq) experiments.

While antibody quality and chromatin interactions are known to affect ChIP-seq reliability, our study found that GC- and CpG-rich sequences, DNA methylation, and RNA:DNA hybrids (R-loops) also contribute to these artifacts across species. This work shows how machine learning can uncover hidden biases in genomic data and improve experimental interpretation.
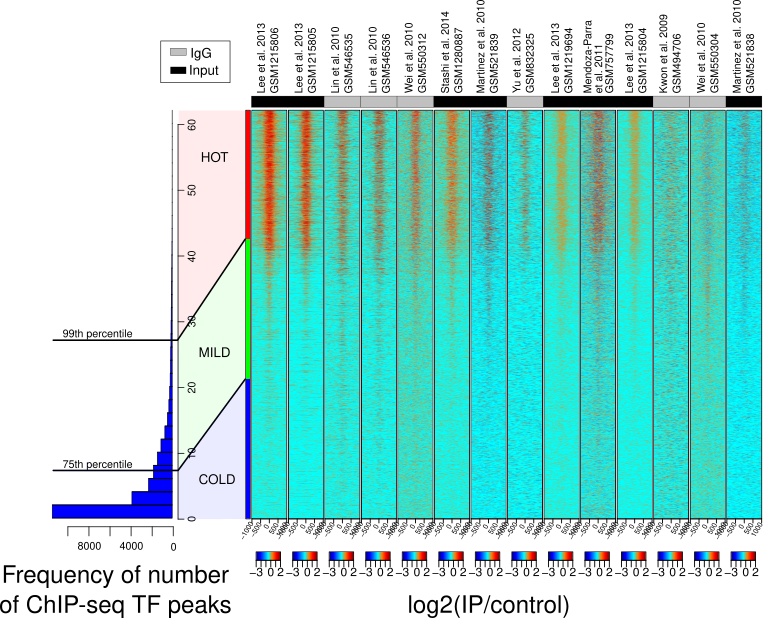
HOT-region ChIP-seq signal comparison
Unexpected ChIP-seq signals appear in HOT regions even without the target protein (KO ChIP-seq). The barplot shows how often these regions are detected as bound. HOT regions correspond to the top 1% of genomic regions with the highest protein-binding signals (99th percentile).

Liquid-biopsy epigenetics in disease

DNA methylation biomarkers in acute coronary syndrome

We investigated circulating cell-free DNA (cfDNA) methylation as a non-invasive biomarker for acute coronary syndrome (ACS), based on the principle that damaged tissues release DNA into the bloodstream. Methylation profiles distinguished ACS subtypes and identified cell-type-specific markers that can help trace the tissue origin of cfDNA. Hundreds of markers linked to cardiovascular conditions and inflammation were validated in an independent cohort.
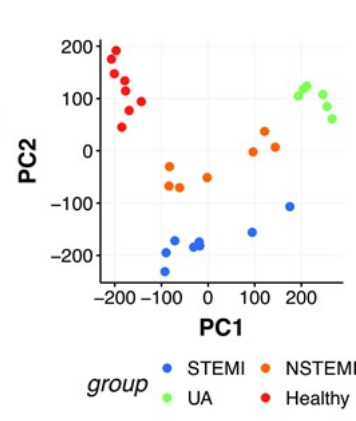
PCA of differentially methylated regions associated with ACS severity
PCA of 254 differentially methylated regions linked to ACS severity using linear models.

DNA methylation profiling in neuroblastoma

In collaboration with Charité Hospital in Berlin, we analyzed primary neuroblastoma tumors and urine-derived cfDNA using bisulfite sequencing and RNA-seq. We identified methylation patterns that distinguish high- and low-risk tumors and linked MYCN-driven methylation changes to disrupted transcription-factor networks, highlighting potential therapeutic targets.
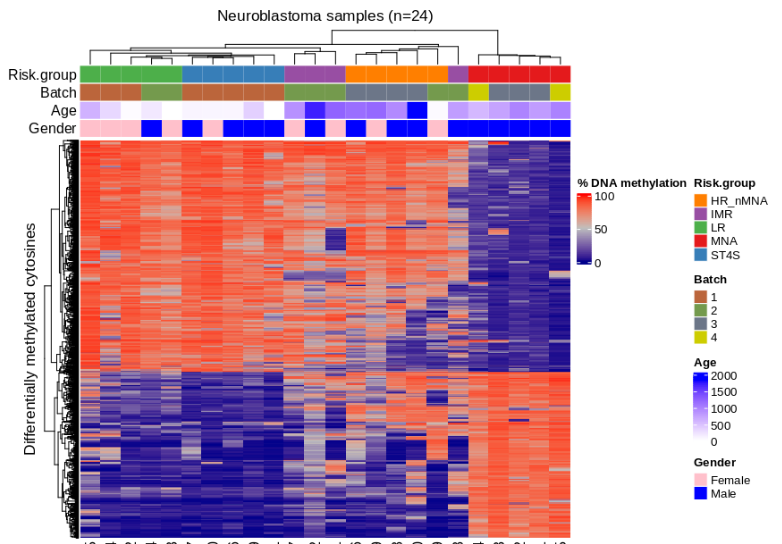
Methylation-based clustering of neuroblastoma patients
Figure: Methylation-based clustering of neuroblastoma patients using differentially methylated CpGs.

Open-source software

genomation

genomation is a Bioconductor R package for genomic feature and interval analysis. It provides tools to read BED/GFF files as GRanges, summarize genomic features across regions, create enrichment plots and heatmaps, and annotate regions with exons, introns, or promoters. I was a co-developer and maintainer.

PiGx

PiGx is a collection of genomics pipelines implemented with Snakemake, Python, and R. Pipelines are configured with a sample sheet and settings file, then generate interactive HTML reports summarizing results. My contribution included co-implementing the PiGx BS-seq pipeline.

motifActivity

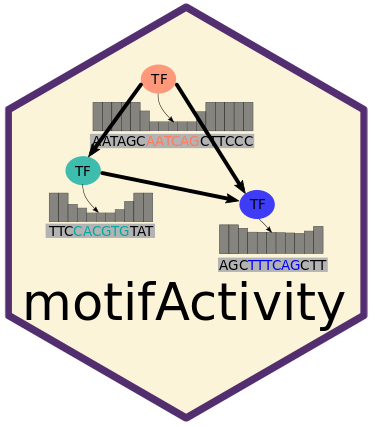
motifActivity is an R package for identifying transcription factors that may explain changes in gene expression or epigenetic marks. It predicts transcription-factor activity from RNA-seq, BS-seq, ChIP-seq, ATAC-seq, and related data, together with DNA motif collections.

Freelance projects

Endometriosis prediction from scRNA-seq data

I built an single-cell RNA-seq workflow using menstrual-effluent samples to detect endometriosis through endometrium-atlas-based cell mapping and composition profiling. It identifies disease-associated shifts in stromal and immune populations and derives a sample-level similarity score.

  • Processed data with nf-core/scrnaseq for standardized quality control, alignment, and count-matrix generation.
  • Used AWS resources to scale preprocessing, reference mapping, and downstream modeling.
  • Mapped donor cells to an endometrium reference atlas using scArches transfer learning, scvi-tools, and PyTorch.
  • Performed analysis in Python with AnnData, Scanpy, scvi-tools, NumPy, pandas, Matplotlib, and seaborn.
  • Derived a sample-level score to classify donors as control-like or endometriosis-like.
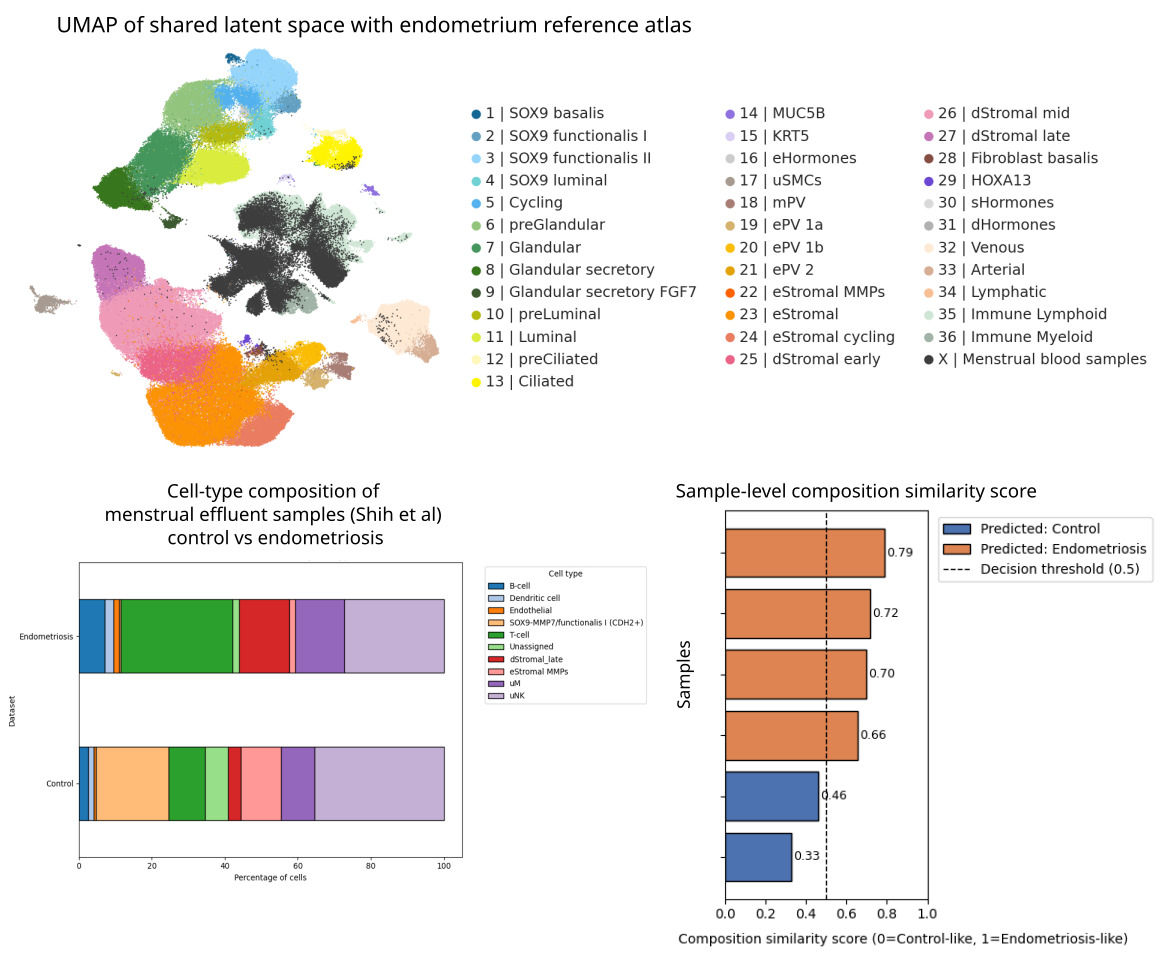
Menstrual-effluent single-cell profiles mapped to an endometrium atlas
Menstrual effluent scRNA-seq profiles were mapped to an endometrium reference atlas to define cell-type composition shifts and generate a sample-level score that distinguishes endometriosis from control donors.

Prioritizing therapeutic targets in clinical trials

Biomarker visualization and survival analysis

We developed interactive visualizations, including oncoprints, to highlight biomarkers in patients with limited treatment options. These summaries reveal genomic alterations and support the identification of potential therapeutic targets. Survival analyses helped assess the clinical relevance of nominated targets in patient cohorts with poor outcomes or few effective therapies.
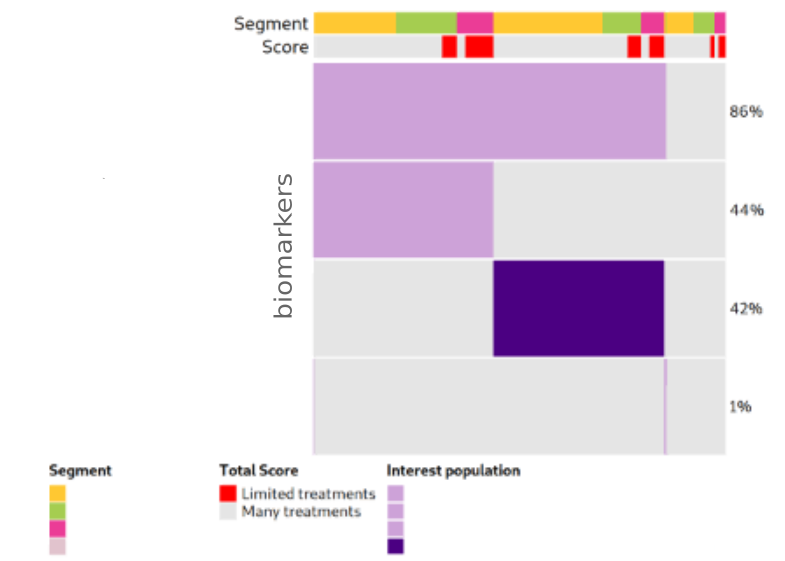
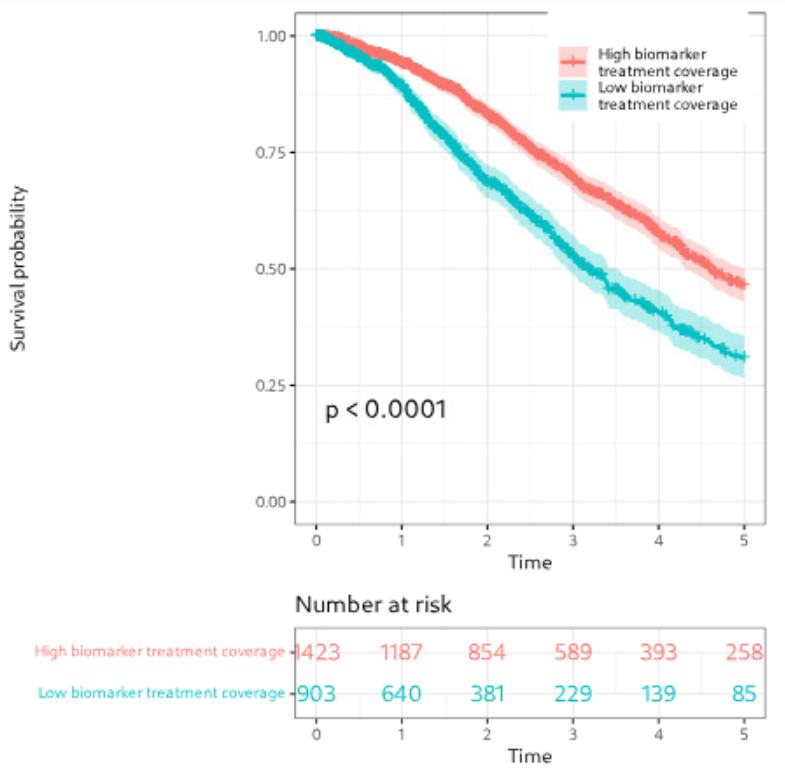
Example biomarker oncoprint Survival analysis of clinical biomarkers
Example of biomarker visualization and survival analysis.

Machine learning for target identification

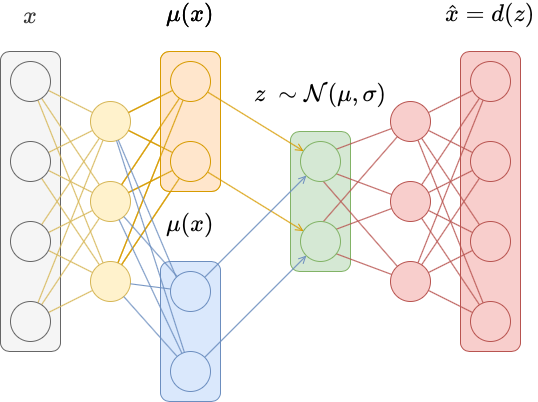
To prioritize therapeutic targets, we applied positive-unlabeled (PU) learning, which is useful when only confirmed targets are labeled. PU classifiers combined gene expression, mutation, and therapy annotations to identify potential targets. We also used autoencoders to uncover hidden patterns and prioritize molecular features without labels.
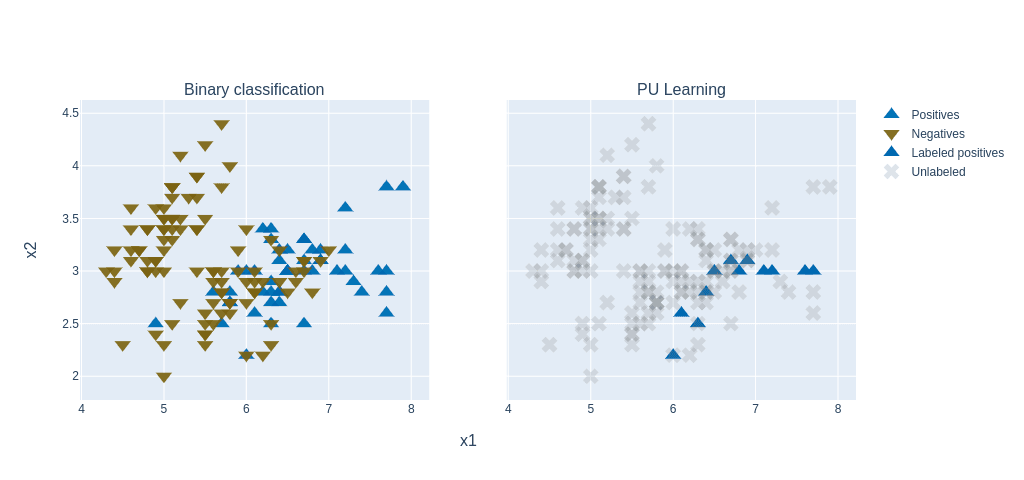
Positive-unlabeled learning concept
PU learning principle (figure adapted from a blogpost).
Variational autoencoder schematic
Schematic of a Variational Autoencoder (figure adapted from a blogpost).

Multi-omics and Enformer for an Alzheimer’s disease biomarker

In this project, I investigated glial-to-neuron reprogramming through activation of a specific transcription factor (TF) in Alzheimer’s disease.

I integrated multi-omics data—including RNA-seq, ATAC-seq, and H3K4me2/H3K27me3 ChIP-seq—to identify differentially expressed genes and pathways (GO, GSEA), and examine their association with Alzheimer’s disease risk variants (GWAS), regulatory enhancers, DNA motifs, and TF binding sites linked to neuronal differentiation.

Large-scale analyses were executed via Nextflow pipelines on Kubernetes and AWS, ensuring scalable and reproducible processing of NGS datasets.

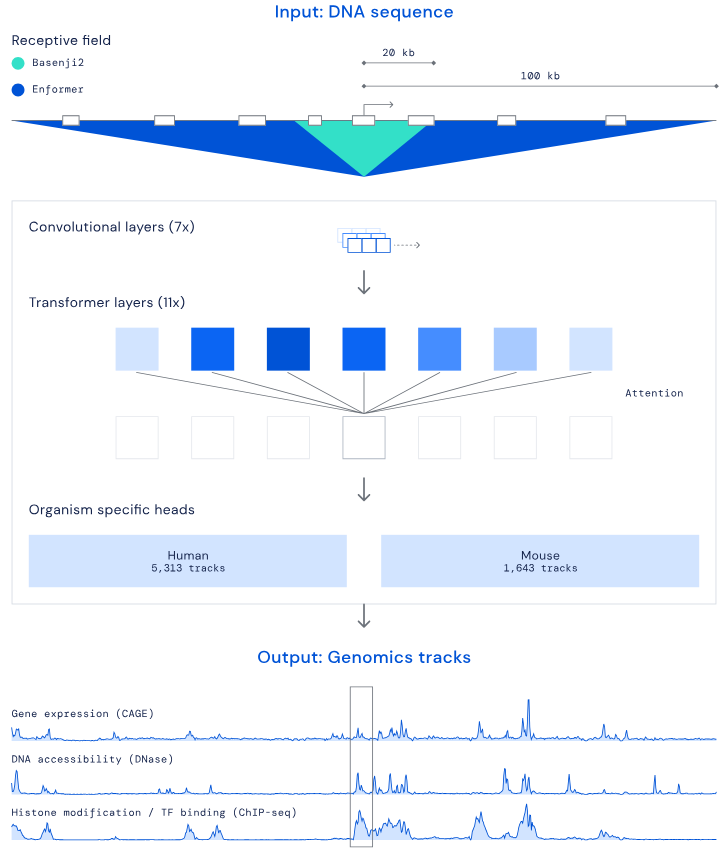
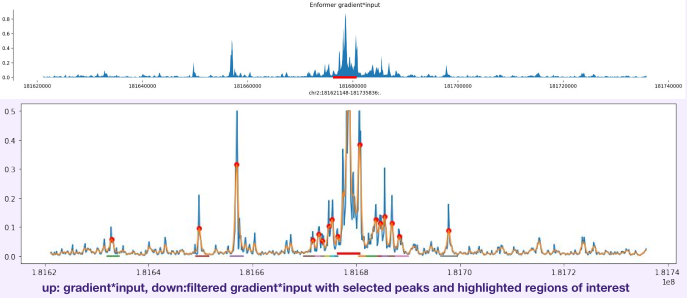
Using Enformer, I mapped the regulatory landscape around the target transcription factor and identified sequence regions predicted to influence its expression in neurons and glia. Enformer predicts regulatory activity from DNA sequence; gradient-based attribution highlights regions with strong effects on gene expression. I analyzed an approximately 400 kb region, applying cell-type-specific masks and signal smoothing to identify candidate enhancers.
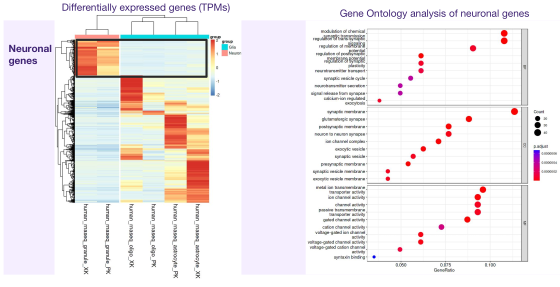
Example RNA-seq analysis
Example RNA-seq analysis.
Motif activity in candidate enhancers
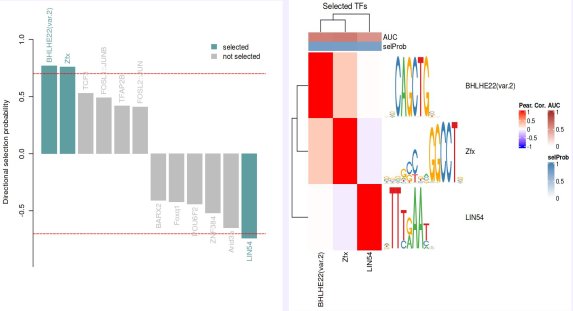
Example DNA motif activity in enhancer regions defined by ATAC-seq and histone-mark ChIP-seq.
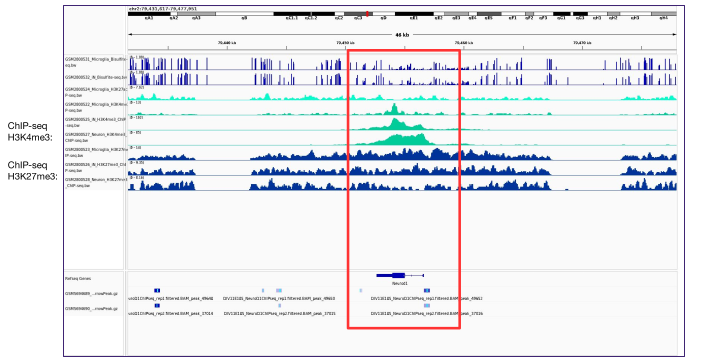
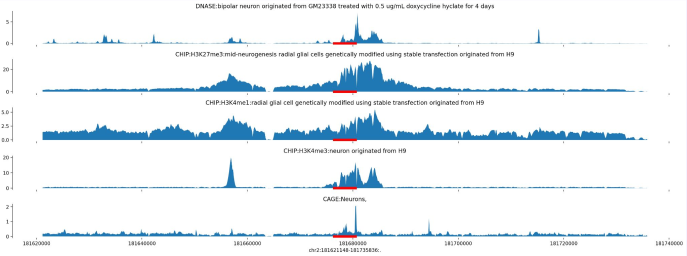
ChIP-seq peaks around the target transcription-factor gene
Example ChIP-seq peaks around the target transcription-factor gene.
Enformer model architecture
Enformer’s architecture by Avsec et al., copied from the blog post.
Enformer output tracks for neurons and glia
Example Enformer tracks for neurons and glia.
Candidate enhancer regions identified with Enformer
Candidate enhancer peaks and regions of interest.

IGV web-app feature development

I contributed to the IGV web application, an interactive tool for exploring genomic data (source code). The work used JavaScript and Python and enabled visualization of public and in-house datasets.

  • Enabled dynamic visualization of new in-house genomic datasets.
  • Added highlighting of genomic regions of interest, including variants.
  • Added RefSeq and GENCODE transcript controls to collapse or expand isoforms, extend selected gene isoforms, and adjust track widths.
  • Linked visualized tracks to their source databases.
  • Implemented a command-line tool to generate snapshots of specified genes or regions.
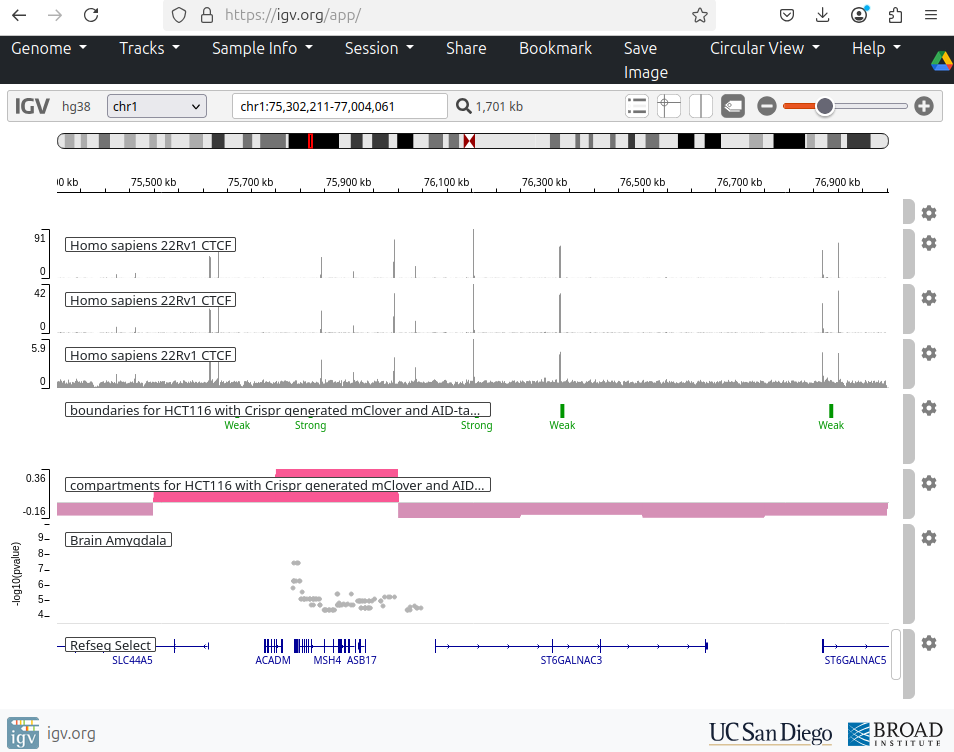
IGV web application showing genomic data tracks
Example IGV web-app view with genomic data tracks.

Proteomic signatures for Crohn’s disease

In this project, I worked with biobank data from IBD Plexus, a resource of the Crohn’s & Colitis Foundation, to explore machine-learning approaches for identifying proteomic signatures to support blood-based testing for Crohn’s disease. I also developed AWS infrastructure to support the associated data workflows.

ROC curves for the Endoscopic Healing Index and fecal calprotectin distinguishing active Crohn’s disease from endoscopic remission
ROC curves for the Endoscopic Healing Index (EHI) and fecal calprotectin (FC) for distinguishing active disease from endoscopic remission. Figure from D’Haens et al., “Development and Validation of a Test to Monitor Endoscopic Activity in Patients With Crohn’s Disease Based on Serum Levels of Proteins,” Gastroenterology (2020).
AWS VPC example with public and private subnets, NAT gateways, and application servers
Reference diagram of a VPC with public and private subnets and NAT gateways. Source: Amazon VPC documentation.

Independent projects

Machine learning and AI

End-to-end machine-learning APIs

Gene-type prediction from DNA sequence

Built classical machine-learning models, convolutional networks, and a custom nucleotide-level Transformer to predict gene type from raw DNA sequence. The deployment work explored ONNX Runtime inference, FastAPI and BentoML serving, Docker Compose, Kubernetes with Kind, and AWS EKS.

Gene and nucleotide sequence example
Example gene and its nucleotide sequence.

Molecular solubility prediction

Built a Flask API to predict whether a compound dissolves in water from molecular descriptors such as size, polarity, solvation energy, and charge distribution. I compared Partial Least Squares, Elastic Net, Random Forest, and XGBoost models and deployed the service to AWS Elastic Beanstalk.

Conceptual illustration of molecular solubility prediction
Conceptual view of molecular solubility prediction.

Immune-cell image classifier

Evaluated transfer learning for classifying immune-cell types in H&E-stained blood microscopy images. A pretrained Xception model served as a fixed feature extractor with a custom MLP classification head. I also trained logistic regression and XGBoost on Xception embeddings as interpretable baselines, tuning learning rate and dropout; the MLP-based model performed strongly on held-out data. The API was deployed with Docker and AWS Lambda.

Examples of blood-cell types
Examples of blood-cell types: erythroblast, monocyte, and platelet.

Diffusion-based image inpainting

Explored diffusion models for reconstructing missing regions in H&E-stained blood-cell images. The compact diffusion model restores masked areas while preserving observed context and is presented through a simple Streamlit interface, with AWS Batch used for deployment.

Diffusion-based inpainting results
Inpainting results: reconstructing masked regions while retaining surrounding image context.

Survival analysis using gene expression & clinical data (Cox models)

Developed models to predict mortality or relapse risk in newly diagnosed multiple-myeloma patients using baseline clinical and gene-expression data. The workflow included RNA-seq preprocessing, PCA and clustering, Cox regression, random survival forests, LASSO-based feature selection, and pathway-informed models, evaluated using the concordance index (C-index).

Comparison of survival models by C-index Kaplan–Meier plot for the best-performing survival model
C-index comparison of multiple survival models (left) and Kaplan–Meier plot of the best-performing model (right).

Deep learning for imaging and omics

CNNs and transfer learning for chest X-ray classification

I applied convolutional neural networks (CNNs) to classify chest X-ray images using both 224×224 and 64×64 pixel inputs, exploring whether lightweight models can retain diagnostic performance. Alongside a baseline CNN trained from scratch, I used transfer learning with pretrained convolutional backbones such as ResNet to assess whether pretraining could improve classification.

Example healthy chest X-ray
Healthy example.
Example chest X-ray showing pneumonia
Pneumonia example.

Autoencoder for scRNA-seq dimensionality reduction and data imputation

I developed a simple autoencoder with a custom loss function for imputing missing values in single-cell RNA-seq data. The approach was inspired by the method proposed by Badsha et al.

Imputed single-cell RNA-seq data
Imputed scRNA-seq data.
Observed and imputed gene expression values
Model output compared with true gene-expression values. Non-imputed data (blue) show reconstructed known values; imputed data (orange) show predictions for missing (masked) values.

Federated VAE for scRNA-seq batch correction

Explored federated training of a scVI model using the Flower framework and SecAgg+ secure aggregation, and compared it with centralized training to study mitigation of batch effects in single-cell RNA-seq.

Baseline gene-expression UMAP
Baseline gene-expression UMAP.
UMAP after centralized scVI batch correction
Centralized scVI model.
UMAP after federated scVI batch correction
Federated scVI model.

cfDNA cell-type deconvolution

Studied cfDNA fragments released by tissues into the blood as a potential source of early disease signals. Applied regression-based methods (NNLS, Lasso, Ridge, Elastic Net) to estimate cell-type proportions from bulk DNA methylation data, and developed:

  • A variational autoencoder (VAE) that reconstructs CpG profiles while jointly predicting cell-type proportions.
  • A semi-supervised NMF model anchored to known reference signatures.
  • A lightweight transformer that treats CpG regions as tokens and uses embeddings and self-attention to capture genomic dependencies.
Cell-type deconvolution of blood DNA methylation data
Deconvolution of blood DNA methylation measured by bisulfite sequencing.

GNN for spatial transcriptomics

This project demonstrates how graph neural networks (GNNs) can capture spatially coherent patterns in gene expression, comparing their learned embeddings with traditional PCA and k-means clustering.

Spatial transcriptomics measures gene expression while preserving tissue architecture, enabling the study of cellular organization and microenvironments. Identifying spatial domains—regions with similar expression and spatial context—remains challenging.

Because GNNs model both gene-expression features and spatial neighborhood relationships, I implemented a mini graph autoencoder (GAE) from scratch in PyTorch to learn unsupervised embeddings of tissue spots. The project uses Squidpy’s toy 10x Genomics Visium H&E mouse-brain dataset (about 2,700 spots and 33,000 genes).

Baseline PCA and k-means spatial clustering
Baseline PCA + KMeans.
GNN-based spatial clustering
GNN-based clustering.

LLM assistant for bioinformatics queries

Developed an AI assistant that translates plain-English biology questions into SPARQL queries against UniProt (proteins and annotations), OMA (orthology), and Bgee (gene expression). The assistant combines Mistral or Llama models, available through Groq or Ollama, with retrieval-augmented generation using Qdrant and FastEmbed. Researchers can use a command-line interface or a Chainlit web app to validate and run queries and receive plain-language summaries.

Chainlit web interface for the bioinformatics assistant
Web UI supporting Mistral, Llama, and Ollama.

Computational biology and algorithms

Protein folding with the HP model and replica Monte Carlo

Implemented simulated annealing and replica-exchange Monte Carlo in Python and NumPy for protein folding in the hydrophobic-polar (HP) lattice model. The model represents amino acids as hydrophobic (H) or polar (P) residues on a square lattice; Metropolis–Hastings sampling explores conformations according to the Boltzmann distribution.

Two-dimensional HP model protein-folding schematic
Example HP-model conformation with optimal energy −2; the two hydrophobic contacts are between residues 4 and 13, and 5 and 12 (Thachuk et al., 2007).

Genome assembly with de Bruijn graphs

Implemented de Bruijn graph-based genome assembly using an Eulerian walk to reconstruct DNA sequences from k-mers. Nodes represent k-mer prefixes and suffixes; edges represent the k-mers. Finding an Eulerian cycle reconstructs a genome by joining successive k-mers with a one-base shift, avoiding the cost of searching for a Hamiltonian cycle.

De Bruijn graph built from a sequence containing repeats
Example de Bruijn graph from a sequence with repeats (Compeau et al., 2011).
Comparison of Hamiltonian and Eulerian genome-assembly strategies
Genome assembly strategies, from Hamiltonian to Eulerian cycles (Pevzner et al., 2001); focus on the Eulerian-cycle approach.

Phylogenetic tree estimation with Felsenstein pruning and NNI

Implemented Felsenstein’s tree-pruning algorithm for evaluating evolutionary-tree likelihoods from nucleic-acid sequences, together with nearest-neighbor interchange (NNI) for rearranging rooted binary phylogenetic trees under the Jukes–Cantor substitution model.

Nearest-neighbor interchange on a subsplit directed acyclic graph
Example NNI on a subsplit directed acyclic graph.

Regulatory DNA discovery with comparative genomics

Bio Motif Ensembl is a Python tool for discovering candidate regulatory DNA regions across related mammalian genomes using Ensembl’s public MySQL databases. It retrieves orthologous sequences (for example, human, mouse, and rat), aligns upstream regions, detects conserved non-coding segments, and analyzes them with motif-discovery tools such as MEME and AlignACE. A binomial model tests motif over-representation to identify potentially functional regulatory elements.

Over-represented motif discovery concept
Concept related to comparative regulatory-motif discovery.

Data engineering

Streaming analytics for urban bike sharing

This project ingests GBFS bike-station data every minute using Kestra, writes raw events to MinIO and Kafka, loads curated records into PostgreSQL, transforms them with dbt, and serves a two-tile Streamlit dashboard in Docker Compose. AWS infrastructure and CI/CD are provisioned with Terraform.

Bike-sharing analytics dashboard
Dashboard running on an AWS EC2 instance provisioned with Terraform.

Web projects

Spatial transcriptomics explorer

An interactive platform for exploring gene expression in tissue context. It includes a chat interface, AI-powered gene summaries, and spatial-domain analysis through an MCP server.

  • Gene summaries use Ollama, with Mistral 7B as the default model.
  • The chatbox uses the same LLM backend.
  • Spatial-domain analysis uses ChatSpatial MCP with SpaGCN when available, and falls back to Scanpy.
Spatial transcriptomics app preview
Explore precomputed 10x Genomics Visium datasets directly in tissue context, without running computationally intensive pipelines online.

Sudoku

A simple Sudoku game implemented in JavaScript and jQuery.

Sudoku game screenshot

Minesweeper

A classic Minesweeper game implemented in Java using Swing and AWT.

Minesweeper game screenshot

Django web services

Django-based server for visualizing multiple sequence alignments.

Mobile application built with Django, a manifesto app, and localStorage.